
2017 Hurricane Season Forecast
Michael Mugrage and Eric Webb
ejwebb2@ncsu.edu
@webberweather
mcmugrag@ncsu.edu
@NCWx_MIchael_M
NCSU Undergraduates
6/1/17
Michael Mugrage and Eric Webb
ejwebb2@ncsu.edu
@webberweather
mcmugrag@ncsu.edu
@NCWx_MIchael_M
NCSU Undergraduates
6/1/17
Summary
We expect the 2017 Atlantic hurricane season to be moderately above average. Warm ENSO neutral conditions are liable to continue to dominate the tropical Pacific, and the positive phase of the Atlantic Multidecadal Oscillation (AMO) and Atlantic Meridional Mode (AMM) persist and remain prevalent into the heart of the hurricane season. We foresee an above normal Cape Verde season with a higher than normal proportion of Atlantic tropical cyclones (TCs) developing east of the Lesser Antilles and south of 20N. This is due in large part to persistence of above normal sea surface temperature anomalies (SSTAs) in the tropical Atlantic, near-slightly below average wind shear, in conjunction with persistence of a wet multidecadal regime in the African Sahel. We further anticipate that a relatively large fraction of these tropical cyclones will track from the east-central tropical Atlantic to near and just north of the Greater Antilles and into the southwestern Atlantic/Sargasso Sea. On the other hand, given that the northeastern Pacific basin will likely be more active than normal yet again this year, there’s more uncertainty than normal in track densities and total activity in the Caribbean Sea and Gulf of Mexico. Regardless of the forecast, all individuals and interests in and around the Caribbean Sea, Gulf of Mexico, and Atlantic Ocean should remained adequately prepared for the upcoming hurricane season.
Hurricane Season Predictors
Atlantic Multidecadal Oscillation (AMO)/Atlantic Meridional Mode (AMM):
The Atlantic Multidecadal Oscillation (AMO) is often referred to as the leading mode of multidecadal sea surface temperature variability in the North Atlantic Ocean. The AMO is characterized by a tripole of sea surface temperature anomalies, with loading centers in the far North Atlantic south of Greenland and the west coast of Africa with an opposing center in the southwestern Atlantic and near east coast of the US. The sea surface temperature variations in the North Atlantic are often coupled to and moderately representative of higher frequency, atmospheric “white noise” that’s linked to the North Atlantic Oscillation (NAO) and the AMO exhibits robust interannual variability (especially during the Boreal Winter) in response to ENSO. Unfortunately, variations in subsurface temperature, salinity, and heat fluxes important to the maintenance and evolution of the Atlantic Mulitdecadal Oscillation and Thermohaline Circulation (THC) are not effectively captured by a SST-only AMO index.
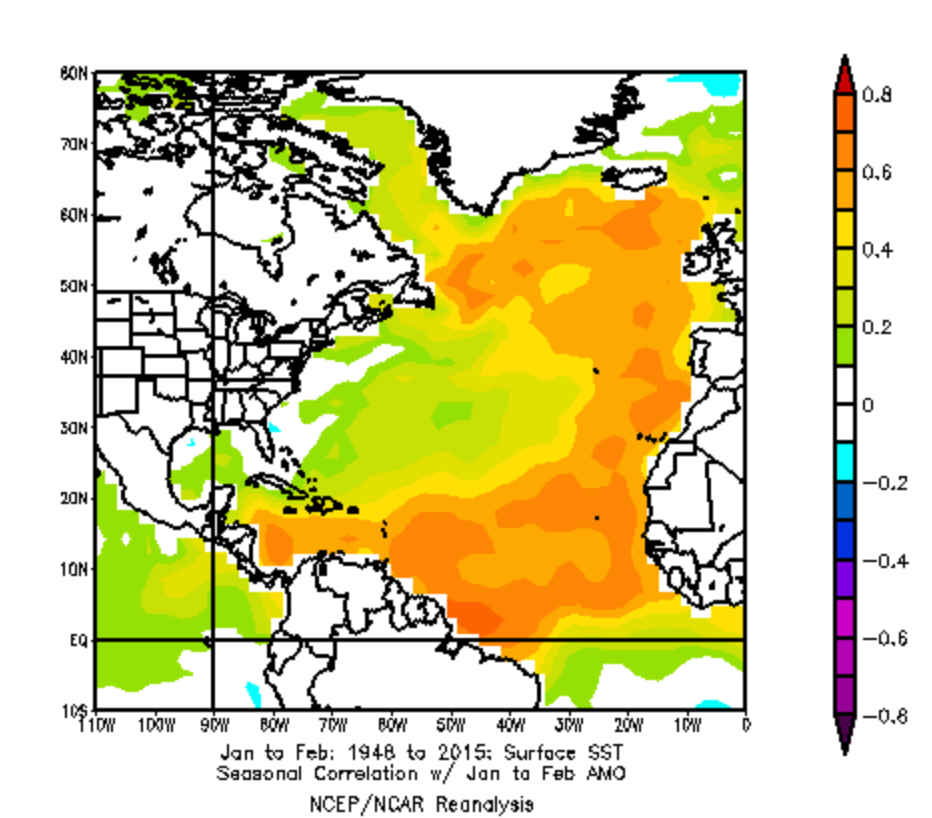
Figure 1. January-February SST Correlation with the AMO (1948-2015) NCEP-NCAR Reanalysis
It’s also worth mentioning Zhang and Delworth (2006) note that the northward shift of the Atlantic ITCZ observed during the warm phase of the AMO is associated with enhancement of the monsoon southwesterlies over the African Sahel and India and lower SLP over Eurasia, therefore increasing the ferocity of the southeast Asia monsoon circulation and reducing snowcover in Tibet.
The Atlantic Meridional Mode (AMM) is a dominant mode of coupled ocean-atmosphere variability in the near-equatorial Atlantic, encompassing the tropical North Atlantic, Gulf of Guinea, and portions of the subtropical South Atlantic, and is derived from Maximum Covariance Analysis (MCA) of sea surface temperature and sea level pressure, although it may be approximated as the 2nd leading Empirical Orthogonal Function (EOF) of these respective fields. The AMM affects rainfall in adjacent areas of equatorial South America, (particularly Brazil), as well as equatorial and sub saharan west-central Africa by modulating the local Hadley Cell network, and thus cross-equatorial sea level pressure and sea surface temperature anomalies. The AMM peaks in the boreal spring and summer and is augmented by “wind-evaporation-SST feedbacks” (Amaya et al (2016)). This feedback involves positive sea surface temperature perturbations augmenting local surface heat fluxes by instigating anomalous cross-equatorial flow that destructively interferes with the trade winds and leads to increased southward propagation of the initial sea surface temperature anomaly (Amaya et al (2016)). Therefore, this feedback allows the ocean and overlying atmosphere to effectively couple and produce spatially and temporally coherent seasonal-interannual variability that's expressed here as the AMM. A positive (negative) AMM is distinguished by positive (negative) sea surface temperature anomalies in the tropical North Atlantic and negative (positive) sea surface temperature anomalies in the southern tropical Atlantic and Gulf of Guinea with concomitant enhancement (suppression) of cross-equatorial, meridional wind anomalies from the tropical-subtropical south Atlantic to the tropical North Atlantic.
The Atlantic Meridional Mode (AMM) is a dominant mode of coupled ocean-atmosphere variability in the near-equatorial Atlantic, encompassing the tropical North Atlantic, Gulf of Guinea, and portions of the subtropical South Atlantic, and is derived from Maximum Covariance Analysis (MCA) of sea surface temperature and sea level pressure, although it may be approximated as the 2nd leading Empirical Orthogonal Function (EOF) of these respective fields. The AMM affects rainfall in adjacent areas of equatorial South America, (particularly Brazil), as well as equatorial and sub saharan west-central Africa by modulating the local Hadley Cell network, and thus cross-equatorial sea level pressure and sea surface temperature anomalies. The AMM peaks in the boreal spring and summer and is augmented by “wind-evaporation-SST feedbacks” (Amaya et al (2016)). This feedback involves positive sea surface temperature perturbations augmenting local surface heat fluxes by instigating anomalous cross-equatorial flow that destructively interferes with the trade winds and leads to increased southward propagation of the initial sea surface temperature anomaly (Amaya et al (2016)). Therefore, this feedback allows the ocean and overlying atmosphere to effectively couple and produce spatially and temporally coherent seasonal-interannual variability that's expressed here as the AMM. A positive (negative) AMM is distinguished by positive (negative) sea surface temperature anomalies in the tropical North Atlantic and negative (positive) sea surface temperature anomalies in the southern tropical Atlantic and Gulf of Guinea with concomitant enhancement (suppression) of cross-equatorial, meridional wind anomalies from the tropical-subtropical south Atlantic to the tropical North Atlantic.
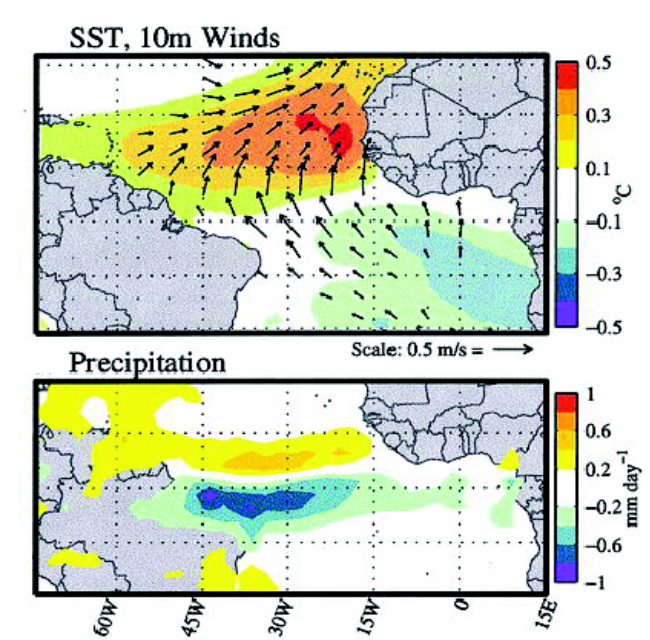
Figure 2. SST and 10m winds (top) precipitation (bottom) anomalies derived from Maximum Covariance Analysis (MCA) for the equatorial Atlantic.
El Nino Southern Oscillation (ENSO):
The El Nino Southern Oscillation (ENSO) is the most prominent mode of interannual variability on the globe, whose alterations in tropical Pacific sea surface temperature, sea level pressure, zonal and meridional wind, and cloudiness significantly influence the placement, intensity, and lifetime of convection in the tropics, and the strength and breadth of the Hadley and Walker Circulations. The anomalous convective heating near the edge of the Indo-western pacific warm pool, augmented by eastward displacement of sufficiently warm underlying sea surface temperatures, lead to the development of quasi-stationary Rossby wave trains that are fueled by low-mid level heating anomalies that initiate geopotential height anomalies directly over the aforementioned anomalous heating centers. These diabatically forced geopotential height centers are associated with an increased influx of angular momentum deposition into the subtropical jet and ultimately impact the placement of a quasi-stationary tropical upper tropospheric trough (TUTT) in the southwestern Atlantic and thus influence the climatological wind shear here, thereby impacting the frequency, intensity, and longevity of TCs in the tropical Atlantic. During El Ninos (La Ninas), the subtropical jet becomes stronger (weaker) and more (less) extensive than normal in the western hemisphere and the Rossby Wave train emanating from the convective heating center is displaced eastward (westward) of its climatological position. This displacement amplifies (weakens) the Atlantic TUTT and henceforth wind shear in the tropical Atlantic.
Note how in figure 4, from the standpoint of a La Nina, an anomalous rossby wave train (RWT) emanates from the tropical Pacific. This RWT is denoted by a pair of cyclonic streamfunction anomaly centers off the equator which then favors the development of positive streamfunction anomalies to the north of the equator in the western hemisphere. Higher positive upper level height anomalies with increasing latitude here dictates that there must exist an anomalous upper level easterly jet further to the south over the tropical Atlantic. This argues that the climatological westerly wind shear in the Atlantic is weaker, therefore the environment is more conducive to tropical cyclones in the tropical Atlantic during La Ninas and vis versa during El Ninos.
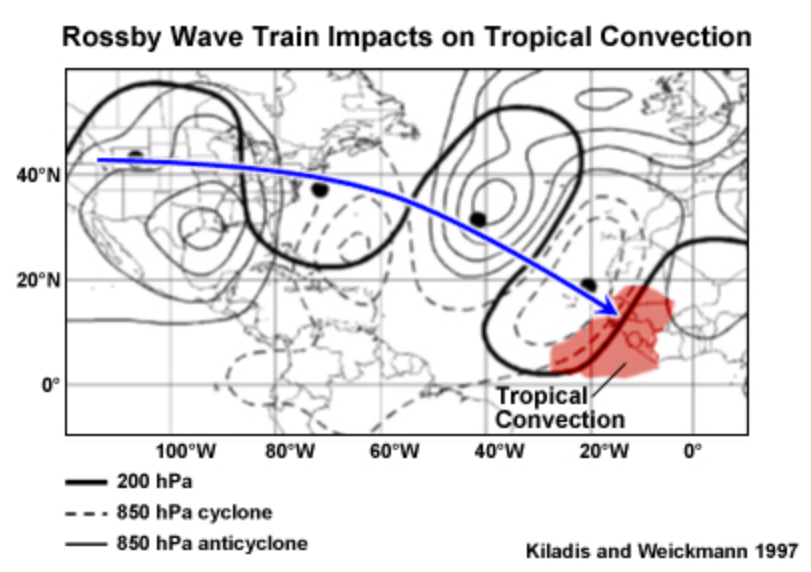
Figure 3. Taken from Kiladis and Weickmann (1997) and Meted showing an arbitrary Rossby Wave Train over the western hemisphere with its direction of propagation shown by the blue arrow and corresponding lower and upper level height anomalies depicted by the dashed/thin solid and thick, solid lines respectively.
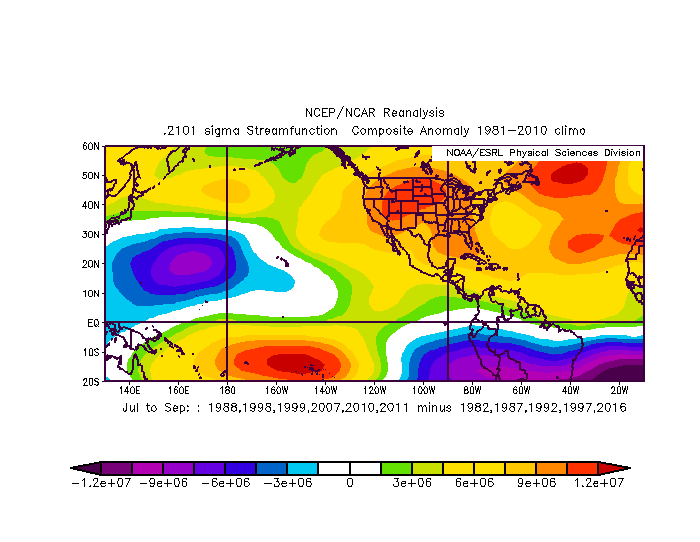
Figure 4. .2101 sigma (upper troposphere) streamfunction anomaly difference for 6 La Nina (1988, 1998, 1999, 2007, 2010, 2011) and 5 El Nino (1982, 1987, 1992, 1997, 2016) years during the 1981-2010 period.
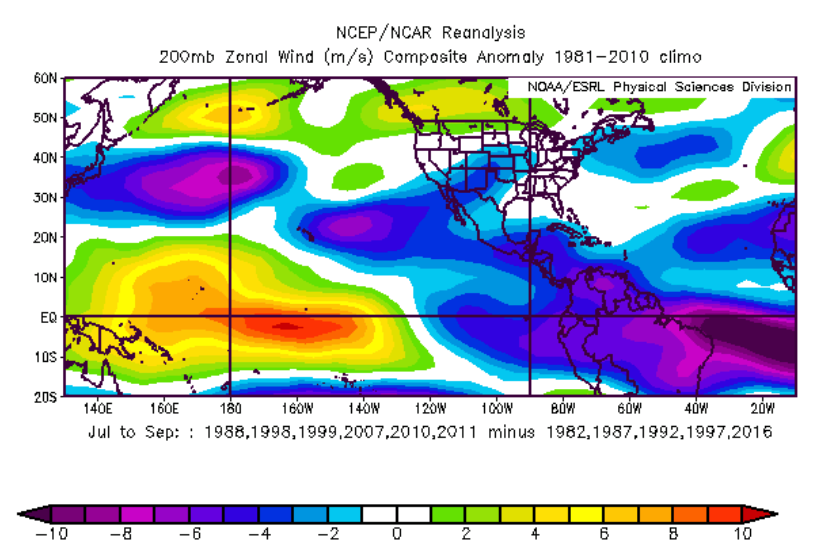
Figure 5. 200mb zonal wind anomaly difference for 6 La Nina (1988, 1998, 1999, 2007, 2010, 2011) and 5 El Nino (1982, 1987, 1992, 1997, 2016) years during the 1981-2010 period.
African Easterly Jet (AEJ):
The African Easterly Jet (AEJ) lies approximately 3 km above earth’s surface (~600-700mb), and flows westward across the tropical region of northern Africa in the boreal summer, attaining maximum amplitude in September and reaching its pinnacle wrt latitudinal distance from the equator in August. This jet forms primarily due to a unique meridional contrast in temperature and soil moisture between the hot, dry Sahara Desert to the north and the relatively cool/moist Gulf of Guinea further south. African Easterly Waves (AEWs) form along and immediately south of this jet wherein cyclonic relative vorticity is maximized. These waves are further amplified by mesoscale convective complexes (MCCs) that develop within the jet and along and immediately in advance of the easterly wave axes. These MCCs owe their origin in part to mountain complexes such as Hijaz and Asir mountains over the Arabian peninsula, the Ethiopian Highlands, and Darfur Mountains (among others) that provide high level heat and potential vorticity sources necessary for convective initiation and enhancement of the easterly wave disturbances. These easterly waves derive their energy from the AEJ and therefore tend to weaken it, while the mean meridional circulation attempts to amplify the AEJ. The African easterly jet undergoes significant weekly-intraseasonal variability thanks primarily to the passage of convectively coupled equatorial waves such as the Madden Julian Oscillation and Convectively Coupled Kelvin Waves, that may periodically enhance/suppress the jet (and thus affect the potential instability available for AEWs) through anomalous momentum and heat fluxes. The easterly waves across Africa generally serve as the seedlings for Atlantic TCs, and may become tropical cyclones after emerging off the west coast of Africa if favorable conditions permit their intensification. Although only 15% of AEWs become TCs (Hopsch et al (2010)), approximately 90% of all Atlantic tropical cyclones can trace their origins to AEWs, therefore it’s important to understand the conditions and phenomena (such as the AEJ) that influence their evolution, intensity, and longevity.
The African Easterly Jet (AEJ) lies approximately 3 km above earth’s surface (~600-700mb), and flows westward across the tropical region of northern Africa in the boreal summer, attaining maximum amplitude in September and reaching its pinnacle wrt latitudinal distance from the equator in August. This jet forms primarily due to a unique meridional contrast in temperature and soil moisture between the hot, dry Sahara Desert to the north and the relatively cool/moist Gulf of Guinea further south. African Easterly Waves (AEWs) form along and immediately south of this jet wherein cyclonic relative vorticity is maximized. These waves are further amplified by mesoscale convective complexes (MCCs) that develop within the jet and along and immediately in advance of the easterly wave axes. These MCCs owe their origin in part to mountain complexes such as Hijaz and Asir mountains over the Arabian peninsula, the Ethiopian Highlands, and Darfur Mountains (among others) that provide high level heat and potential vorticity sources necessary for convective initiation and enhancement of the easterly wave disturbances. These easterly waves derive their energy from the AEJ and therefore tend to weaken it, while the mean meridional circulation attempts to amplify the AEJ. The African easterly jet undergoes significant weekly-intraseasonal variability thanks primarily to the passage of convectively coupled equatorial waves such as the Madden Julian Oscillation and Convectively Coupled Kelvin Waves, that may periodically enhance/suppress the jet (and thus affect the potential instability available for AEWs) through anomalous momentum and heat fluxes. The easterly waves across Africa generally serve as the seedlings for Atlantic TCs, and may become tropical cyclones after emerging off the west coast of Africa if favorable conditions permit their intensification. Although only 15% of AEWs become TCs (Hopsch et al (2010)), approximately 90% of all Atlantic tropical cyclones can trace their origins to AEWs, therefore it’s important to understand the conditions and phenomena (such as the AEJ) that influence their evolution, intensity, and longevity.
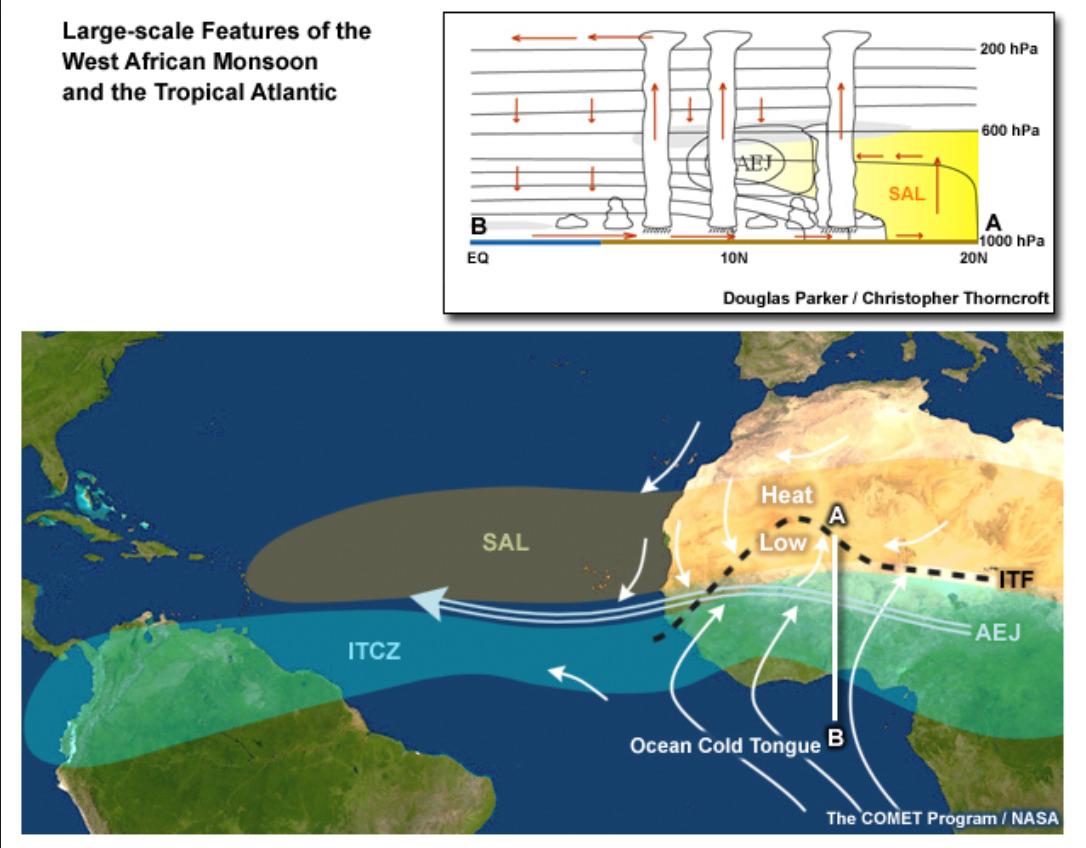
Figure 6. Depicts the structure of the African Easterly Jet via a latitude-height cross-section (top) and graphically shows how the meridional temperature gradient induced by differential in vegetation and heating between the Sahara and Congo fuels AEWs embedded near/south of the jet axis (bottom).
Near average-above normal rainfall is expected across the African Sahel as a modest positive AMM remains place. A warm Gulf of Guinea may be a possible inhibitor to this as it could act to diffuse the meridional thermal gradient present across the region, thus in turn weakening the African Easterly Jet and a primary source of instability with which AEWs grow and become tropical cyclones in the Atlantic. In addition, the long-term trend in Sahel rainfall further supports our expectations of a near-slightly above average season wrt precipitation, wherein a marked increase in precipitation has occurred over the Sahel since the 1980s and 1990s. With this in mind, it is important to note that there are a multitude of other confounding factors that modulate the intensity, placement, and extensiveness of the AEJ.
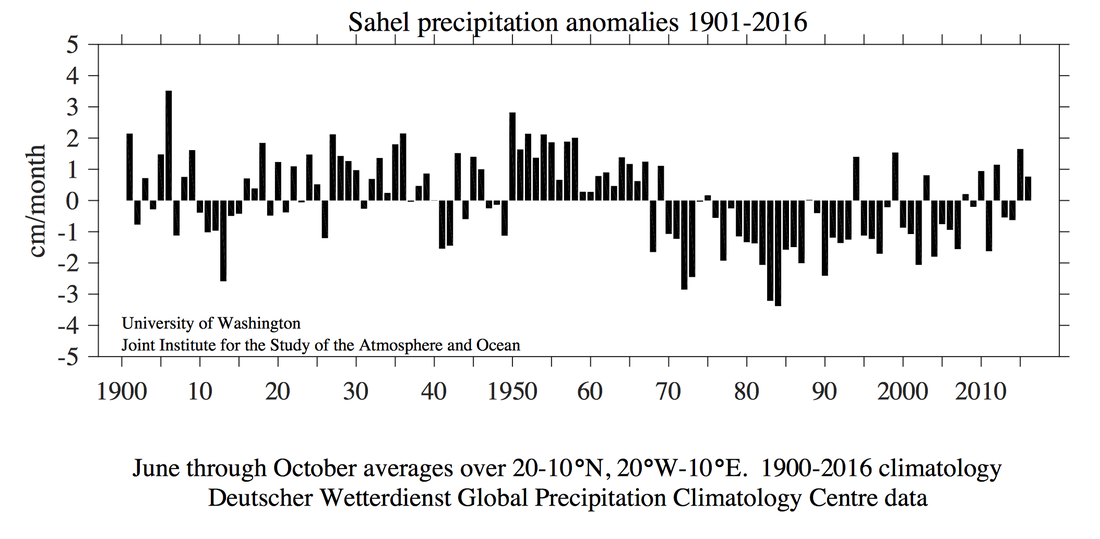
Figure 7. Sahel precipitation anomalies since 1900, note the recent increase in precipitation over the last decade or so. This is important because it indicates more vigorous AEW activity and reduces the prevalence of the Saharan Air Layer (SAL).
Subtropical Indian Ocean Dipole (SIOD):
The Subtropical Indian Ocean Dipole Mode (SIODM) is a coupled ocean-atmosphere phenomena located in the southern Indian Ocean whose positive (negative) phase is characterized by negative (positive) sea surface temperature anomalies (SSTAs) adjacent to western Australia and extending into the central Indian ocean. Concomitant positive (negative) SSTAs southeast of Madagascar, poleward (equatorward) displacement of the Mascarene High and a weaker (stronger) Indian Monsoon via modulation of the local Hadley cell network are also prevalent, and may manifest as an expression of the Antarctic Circumpolar Wave (ACW). Like its counterpart, the Indian Ocean Dipole Mode (IOD), the SIOD also impacts and feeds back onto the Walker Cell, drought frequency, and climatic patterns in adjacent East and Southern Africa, Australia, and Southern Eurasia (Saji et al (1999)) and possesses significant teleconnections with other major modes of weather and climate variability. The positive phase of the SIOD is anticipated to continue for at least the next few months which implies drier than normal conditions will dominate central and northern Africa, however the long-term trend of Sahel rainfall and variability in the equatorial Atlantic Ocean may dampen its influence.
The Subtropical Indian Ocean Dipole Mode (SIODM) is a coupled ocean-atmosphere phenomena located in the southern Indian Ocean whose positive (negative) phase is characterized by negative (positive) sea surface temperature anomalies (SSTAs) adjacent to western Australia and extending into the central Indian ocean. Concomitant positive (negative) SSTAs southeast of Madagascar, poleward (equatorward) displacement of the Mascarene High and a weaker (stronger) Indian Monsoon via modulation of the local Hadley cell network are also prevalent, and may manifest as an expression of the Antarctic Circumpolar Wave (ACW). Like its counterpart, the Indian Ocean Dipole Mode (IOD), the SIOD also impacts and feeds back onto the Walker Cell, drought frequency, and climatic patterns in adjacent East and Southern Africa, Australia, and Southern Eurasia (Saji et al (1999)) and possesses significant teleconnections with other major modes of weather and climate variability. The positive phase of the SIOD is anticipated to continue for at least the next few months which implies drier than normal conditions will dominate central and northern Africa, however the long-term trend of Sahel rainfall and variability in the equatorial Atlantic Ocean may dampen its influence.
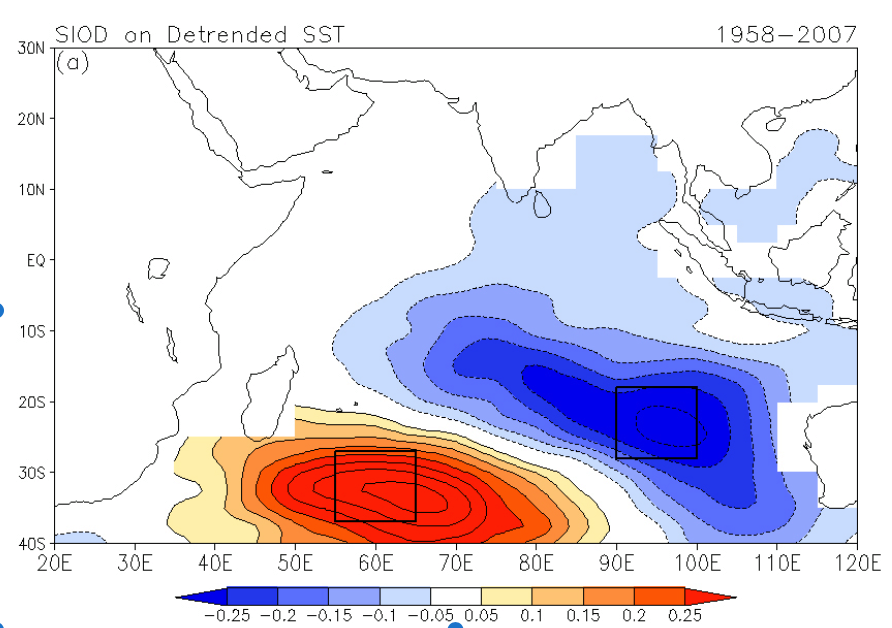
Figure 8. Subtropical Indian Ocean Dipole (SIOD) SST loading pattern
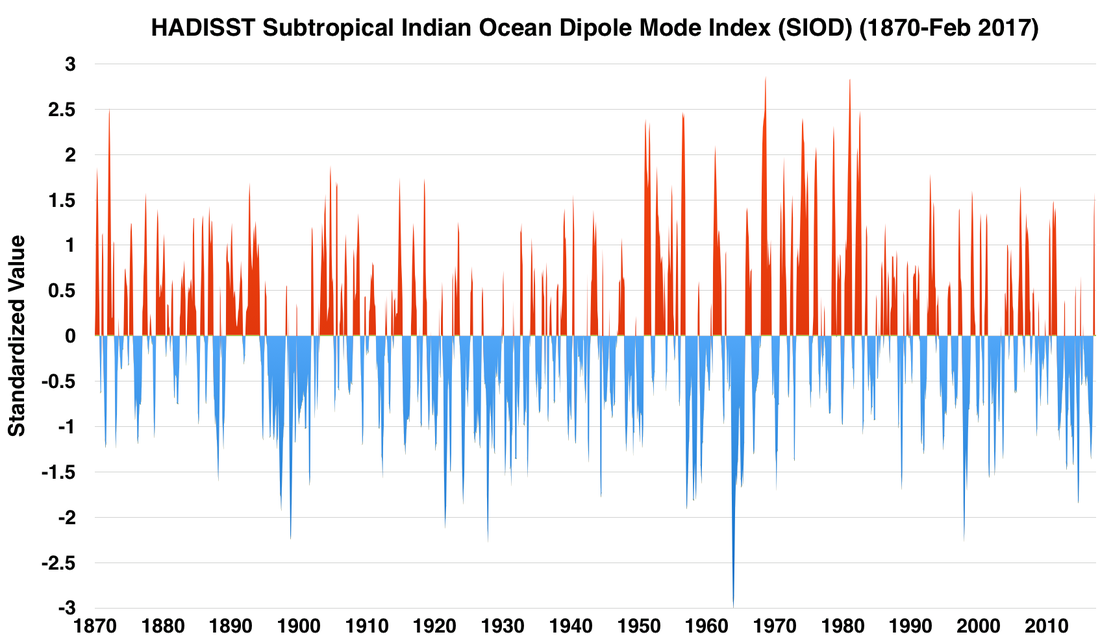
Figure 9. Subtropical Indian Ocean Dipole (SIOD) time series via the Hadley Centre Sea Ice and Sea Surface Temperature (HADISST) dataset (1870-February 2017).
Pacific Decadal Oscillation (PDO):
The Pacific Decadal Oscillation (PDO) is often defined as the leading mode of North Pacific variability, and is marked by a horseshoe of SSTAs within the Kurioshio-Oyashio Extension (KOE) and North Pacific Current, with an opposing SSTA pole along the west coast of North America and into the subtropical North Pacific. The PDO emerges as the non-linear summation of ENSO projection that teleconnects to the PDO via an “atmospheric bridge” (esp during Boreal Winter), North Pacific variability independent of ENSO, stochastic (random) atmospheric white noise, and a seasonally dependent re-emergence mechanism. In addition to providing some interference with ENSO (since the two modes aren’t entirely independent from one another), the PDO is capable of altering the steering flow for Atlantic TCs downstream over the North American continent by modulating the placement and intensity of the mid-latitude storm track. Generally speaking, a cold (warm) PDO entices the persistence and development of a large-scale ridging (troughing) over southeastern Canada and Atlantic Canada that tends to deflect tropical cyclones towards (away from) the US coastline. The Pacific Decadal Oscillation has remained positive for the last several years in a row and may partially explain the relative dearth of major hurricane landfalls on the US coast, and the current warm PDO regime appears to have weakened, albeit only slightly, therefore, we can anticipate the +PDO to potentially serve as a benefactor for US tropical cyclone impacts in the upcoming season.
The Pacific Decadal Oscillation (PDO) is often defined as the leading mode of North Pacific variability, and is marked by a horseshoe of SSTAs within the Kurioshio-Oyashio Extension (KOE) and North Pacific Current, with an opposing SSTA pole along the west coast of North America and into the subtropical North Pacific. The PDO emerges as the non-linear summation of ENSO projection that teleconnects to the PDO via an “atmospheric bridge” (esp during Boreal Winter), North Pacific variability independent of ENSO, stochastic (random) atmospheric white noise, and a seasonally dependent re-emergence mechanism. In addition to providing some interference with ENSO (since the two modes aren’t entirely independent from one another), the PDO is capable of altering the steering flow for Atlantic TCs downstream over the North American continent by modulating the placement and intensity of the mid-latitude storm track. Generally speaking, a cold (warm) PDO entices the persistence and development of a large-scale ridging (troughing) over southeastern Canada and Atlantic Canada that tends to deflect tropical cyclones towards (away from) the US coastline. The Pacific Decadal Oscillation has remained positive for the last several years in a row and may partially explain the relative dearth of major hurricane landfalls on the US coast, and the current warm PDO regime appears to have weakened, albeit only slightly, therefore, we can anticipate the +PDO to potentially serve as a benefactor for US tropical cyclone impacts in the upcoming season.
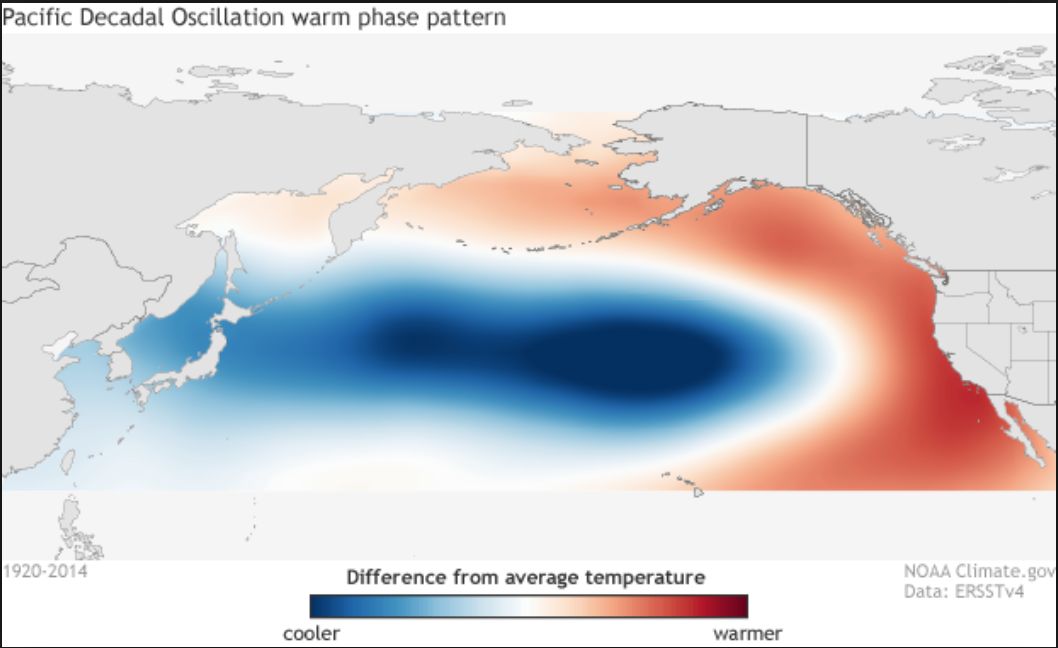
Figure 10. Warm Pacific Decadal Oscillation (+PDO) loading pattern via Extended Reconstructed Sea Surface Temperature Version 4 (ERSSTv4) (1920-2014).
Tropical Easterly Jet (TEJ):
The Tropical Easterly Jet is an upper level easterly jet stream that forms in conjunction with the southeast Asia monsoon circulation as the wintertime westerly jet detours a majority of its accompanying mass north of the Himalayas in the boreal summer. The tropical easterly jet owes its existence to a unique arrangement of the ocean and adjacent continental landmasses over the eastern hemisphere, wherein the continents become warmer than the equatorial Atlantic and Indian Oceans further to the south. Due to this peculiar thermal gradient in the boreal summer, that’s marked by higher temperatures with increasing latitude and referring to the thermal wind relationships, higher temperatures are found to the right of the mean wind and thus an upper level easterly jet grows in response to this temperature gradient. This is in stark contrast to the western hemisphere, where upper level easterlies only exist as turbulent eddies in the troposphere and lower stratosphere. The tropical easterly jet is found in the lower stratosphere and uppermost troposphere around 100-200mb and bisects the Tibet Anticyclone and Monsoon Heat Low, that extend from the west coast of Africa through southeast Asia to near-just north of the Maritime Continent. The tropical easterly jet acts as a potential vorticity reservoir (potential vorticity = static stability * absolute vorticity), which may interact with the surface and African Easterly Jet, also often viewed as reservoirs of potential vorticity. As described by Nicholson (2006), the interactions amongst these three PV reservoirs are postulated to be somewhat dependent on background moisture and wave behavior. One hypothesis promulgates that waves of planetary scale at the level of the TEJ tend to propagate downwards towards the African Easterly Jet (AEJ) in a drier regime and vis versa when the Sahel becomes wet. The latter case features synoptic scale waves embedded in the AEJ propagating upwards and exhibiting rapid growth once they reach the level of the TEJ. The aforementioned information suggests that the TEJ may play a non-negligible role in the evolution of African Easterly Waves embedded within the AEJ, therefore impacting the probability of tropical cyclogenesis downstream in the Atlantic basin. Observations over the past several decades have depicted a marked decrease in the intensity of the TEJ which is likely tied to a disproportionate increase in near surface temperatures over the Indian Ocean. Continuation of this trend may lead to a complete dissolution or reversal of the TEJ in the decades and/or centuries to come.
The Tropical Easterly Jet is an upper level easterly jet stream that forms in conjunction with the southeast Asia monsoon circulation as the wintertime westerly jet detours a majority of its accompanying mass north of the Himalayas in the boreal summer. The tropical easterly jet owes its existence to a unique arrangement of the ocean and adjacent continental landmasses over the eastern hemisphere, wherein the continents become warmer than the equatorial Atlantic and Indian Oceans further to the south. Due to this peculiar thermal gradient in the boreal summer, that’s marked by higher temperatures with increasing latitude and referring to the thermal wind relationships, higher temperatures are found to the right of the mean wind and thus an upper level easterly jet grows in response to this temperature gradient. This is in stark contrast to the western hemisphere, where upper level easterlies only exist as turbulent eddies in the troposphere and lower stratosphere. The tropical easterly jet is found in the lower stratosphere and uppermost troposphere around 100-200mb and bisects the Tibet Anticyclone and Monsoon Heat Low, that extend from the west coast of Africa through southeast Asia to near-just north of the Maritime Continent. The tropical easterly jet acts as a potential vorticity reservoir (potential vorticity = static stability * absolute vorticity), which may interact with the surface and African Easterly Jet, also often viewed as reservoirs of potential vorticity. As described by Nicholson (2006), the interactions amongst these three PV reservoirs are postulated to be somewhat dependent on background moisture and wave behavior. One hypothesis promulgates that waves of planetary scale at the level of the TEJ tend to propagate downwards towards the African Easterly Jet (AEJ) in a drier regime and vis versa when the Sahel becomes wet. The latter case features synoptic scale waves embedded in the AEJ propagating upwards and exhibiting rapid growth once they reach the level of the TEJ. The aforementioned information suggests that the TEJ may play a non-negligible role in the evolution of African Easterly Waves embedded within the AEJ, therefore impacting the probability of tropical cyclogenesis downstream in the Atlantic basin. Observations over the past several decades have depicted a marked decrease in the intensity of the TEJ which is likely tied to a disproportionate increase in near surface temperatures over the Indian Ocean. Continuation of this trend may lead to a complete dissolution or reversal of the TEJ in the decades and/or centuries to come.
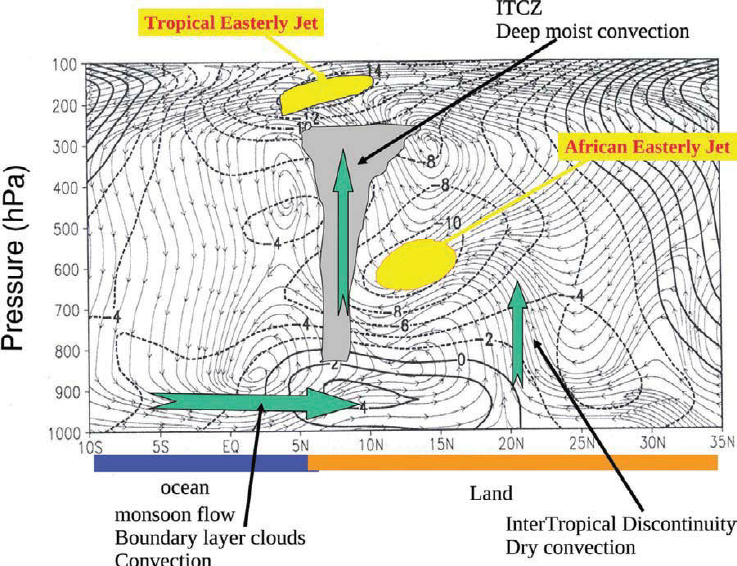
Figure 11. Latitude-height cross section of the West Africa Monsoon System derived from Lafore et al (2010). Note the prevalence of the Afican Easterly Jet in the mid-troposphere just to the north of the epicenter of intense moist convection within the ITCZ, with the Tropical Easterly Jet lying lying immediately over top of the convective complex ~ 100-200mb.
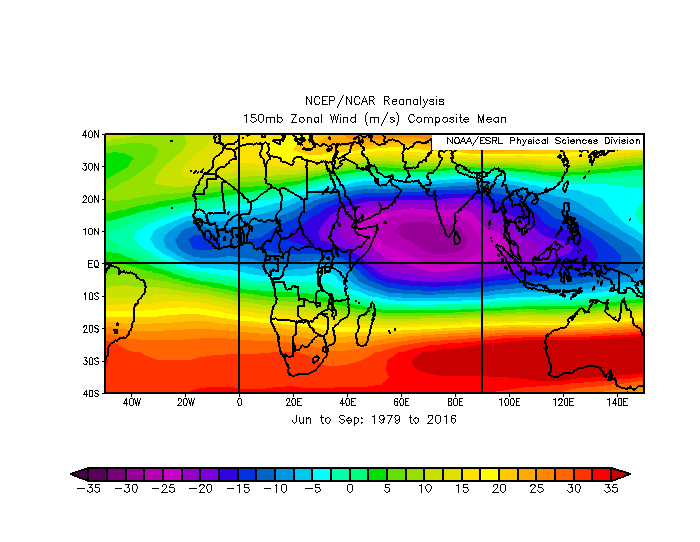
Figure 12. June-September (JJAS) 1979-2016 NCEP-NCAR Reanalysis 150mb mean zonal wind
Methodology:
In order to provide a reasonable range of estimates for the future state of the ocean and atmosphere, a set of historical analogs with similar initial conditions, evolution, and expected seasonal state(s) have been derived. Variables and phenomena such as the El Nino Southern Oscillation, Atlantic Multidecadal Oscillation, global sea surface temperatures, the Atlantic Meridional Mode, Pacific Decadal Oscillation, Subtropical Indian Ocean Dipole, solar activity, global temperatures, and several northern hemisphere atmospheric teleconnections were utilized.
We used the Ensemble Oceanic Nino Index (ENS ONI) (1865-Present) and sifted for years that were within 0.5 standard deviation of the FMA 2017 ENS ONI value (2 points). Years in which the wintertime ENS ONI was between +1.0 and -0.5 received a bonus point. Further, from this subset, those that were coming out of a -ENSO event in the preceding winter received yet another bonus point, and an additional half of a bonus point was awarded to a year that also observed an El Nino in the year prior to the -ENSO event in the preceding winter.
For ENS ONI data see:
http://weatheradvance.com/home/weather/weatheradvance.com/wp-content/uploads/2017/05/Ensemble-Oceanic-NINO-Index-ENS-ONI-Raw-Data-1865-522017.txt
It’s worth noting here that although the recent Super Nino was unusual in the context of other modern events (e.g. 1982-83 and 1997-98), lasting more than a year, and featuring a fairly punctuated and feeble subsequent -ENSO response, eerily similar interannual ENSO behavior was observed in the late 1920s and early 1930s in/around the 1929-1931 El Nino event. ENS ONI ENSO events were defined in accordance with the Trenberth (1997) definition.
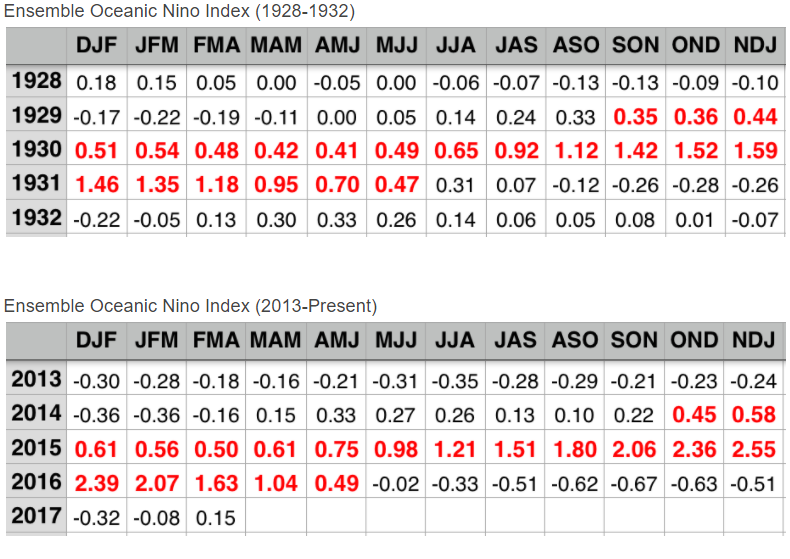
Figure 13. Ensemble Oceanic Nino Index (ENS ONI) values 1928-1932 (top) and 2013-Present (bottom)
Thereafter, we utilized the Hadley Centre Global Sea Ice and Sea Surface Temperature dataset version 1 (HADISST) (Rayner et al (2003)) and Centennial in-situ Observation Based Estimates Version 2 (COBE SST2) (Hirhara et al (2014)) looked for years with a similar global sea surface temperature anomaly distributions. Years that were analogous in the Apr-Jun period to the current global SST distribution were given 2 points
We also analyzed the Atlantic Meridional Mode (AMM) and reconstructed this index using the Externded Reconstructed Sea Surface Temperature Dataset Version 4 (Huang et al (2014)). Although the original AMM defined by Chiang and Vimont (2004) uses Maximum Covariance Analysis for the SST and meridional component of the near surface (10m) wind field, the SST component of the AMM can be reasonably approximated using the 2nd EOF of SSTs over the same region used by Chiang and Vimont (21S-32N, 74W-15E). The data was smoothed with a tri-monthly filter to remove higher frequency noise relatively unrelated to the AMM. Figure 13 shows the detrended sea surface temperature anomaly loading field for June in this region of the near-equatorial Atlantic. Years that were within 0.5 sigma of the February-March-April (FMA) ERSSTv4 AMM index value were given 1 point.
We also analyzed the Atlantic Meridional Mode (AMM) and reconstructed this index using the Externded Reconstructed Sea Surface Temperature Dataset Version 4 (Huang et al (2014)). Although the original AMM defined by Chiang and Vimont (2004) uses Maximum Covariance Analysis for the SST and meridional component of the near surface (10m) wind field, the SST component of the AMM can be reasonably approximated using the 2nd EOF of SSTs over the same region used by Chiang and Vimont (21S-32N, 74W-15E). The data was smoothed with a tri-monthly filter to remove higher frequency noise relatively unrelated to the AMM. Figure 13 shows the detrended sea surface temperature anomaly loading field for June in this region of the near-equatorial Atlantic. Years that were within 0.5 sigma of the February-March-April (FMA) ERSSTv4 AMM index value were given 1 point.
For ERSSTv4 AMM data see: http://weatheradvance.com/home/weather/weatheradvance.com/wp-content/uploads/2017/06/ERSSTv4-AMM-Index-1865-Apr-2017.txt
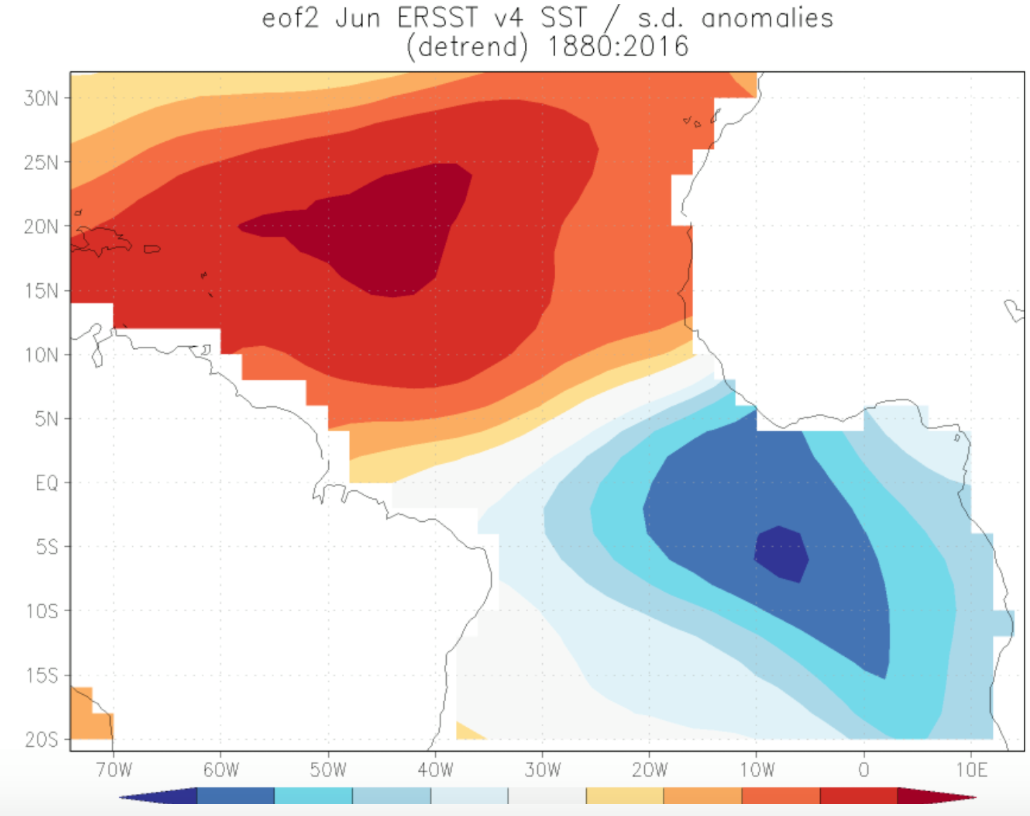
Figure 14. Detrended, sea surface temperature anomalies for the 2nd leading mode (EOF) of near equatorial Atlantic SST variability via ERSSTv4 for June
Analogs were also chosen according to their current initialization of the Atlantic Mulitidecadal Oscillation (AMO) which was attained from HADSST3 provided via the KNMI Climate explorer and standardized wrt the 1880-2016 period, regressed against the mean global temperature, and smoothed with a tri-monthly filter. Years that fell within 0.5 standard deviation of the JFM 2017 HADSST3 AMO value were given 2.5 points.
The Pacific Decadal Oscillation was defined, similar to Mantua (2001), as the leading mode of SST variability poleward of 20N in the North Pacific and was obtained using the Hadley Centre Global Sea Ice and Sea Surface Temperature Version 1 (HADISST) dataset (Rayner et al (2003)). PDO values before 1870 utilized the Extended Reconstructed Sea Surface Temperature Version 4 supplied from the National Centers for Environmental Information (NCEI). DJF PDO values that fell within 0.5 sigma of the DJF PDO values were given 1 point. Figure 15 depicts the December-February SST loading field for the Pacific Decadal Oscillation (in this case showing its negative (cold) phase).
The Pacific Decadal Oscillation was defined, similar to Mantua (2001), as the leading mode of SST variability poleward of 20N in the North Pacific and was obtained using the Hadley Centre Global Sea Ice and Sea Surface Temperature Version 1 (HADISST) dataset (Rayner et al (2003)). PDO values before 1870 utilized the Extended Reconstructed Sea Surface Temperature Version 4 supplied from the National Centers for Environmental Information (NCEI). DJF PDO values that fell within 0.5 sigma of the DJF PDO values were given 1 point. Figure 15 depicts the December-February SST loading field for the Pacific Decadal Oscillation (in this case showing its negative (cold) phase).
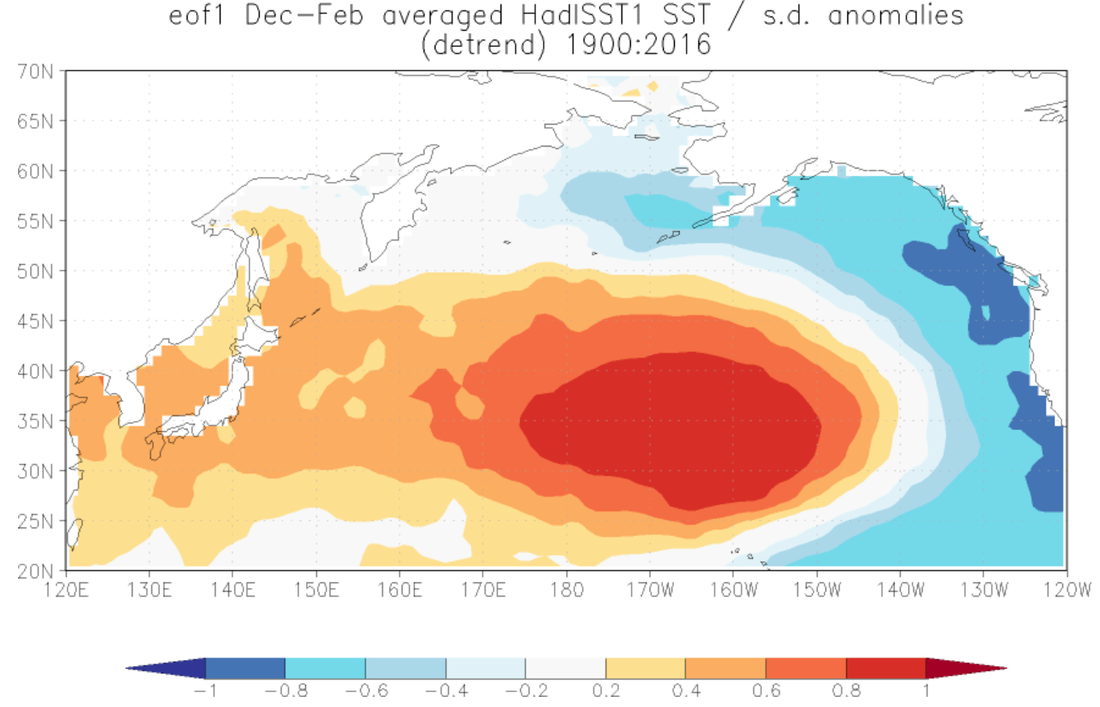
Figure 15. HADISST North Pacific (120E-120W, 20-70N) leading SST EOF (DJF) (1900-2016)
The Subtropical Indian Ocean Dipole (SIOD) index is denoted here as the standardized, detrended SST differential between the western (55E-65E,37-27S) and eastern (90-100E,28-18S) southern subtropical Indian Ocean via HADISST (Rayner et al (2003)) and the data was smoothed with a tri-monthly filter. Years that fell within 0.5 sigma of the December-February SIOD index were allotted a point.
For HADISST SIOD data see: http://weatheradvance.com/home/weather/weatheradvance.com/wp-content/uploads/2017/05/Subtropical-Indian-Ocean-Dipole-Mode-Index-SIODMI-1870-Present-HADISST.txt
For HADISST SIOD data see: http://weatheradvance.com/home/weather/weatheradvance.com/wp-content/uploads/2017/05/Subtropical-Indian-Ocean-Dipole-Mode-Index-SIODMI-1870-Present-HADISST.txt
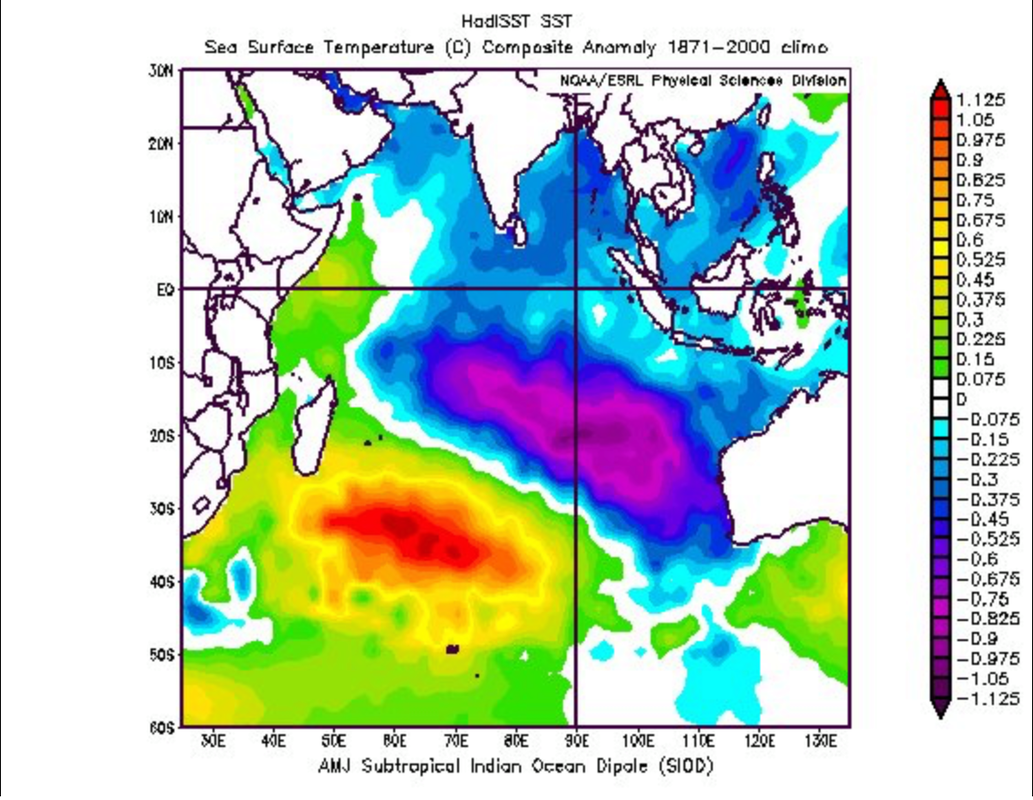
Figure 16. Subtropical Indian Ocean Dipole SST loadings (AMJ).
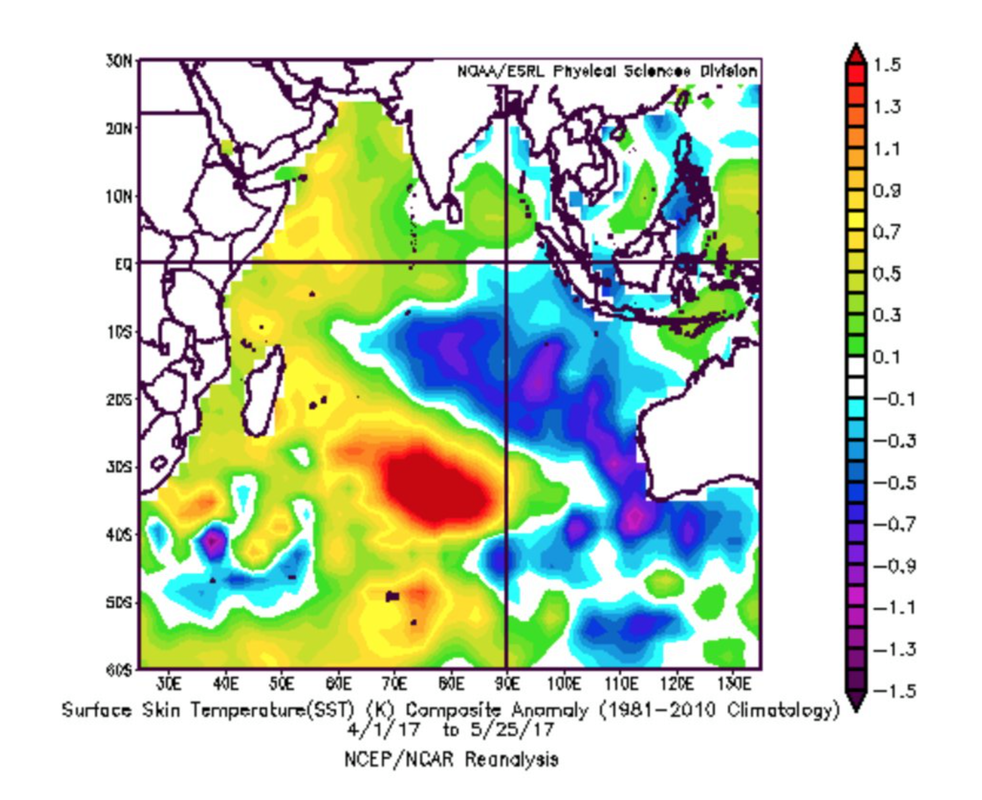
Figure 17. NCEP-NCAR Reanalysis April 1-May 25 2017 Surface Skin Temperature anomalies.
For solar activity we attained the Solar Influences Data Center (SIDC) 13 month smoothed monthly sunspot number data and years that fell within 0.5 sigma of the latest 13 month sunspot number were given one half of a point, years that also were found in the proper phase of a solar cycle were awarded an additional half of a point.
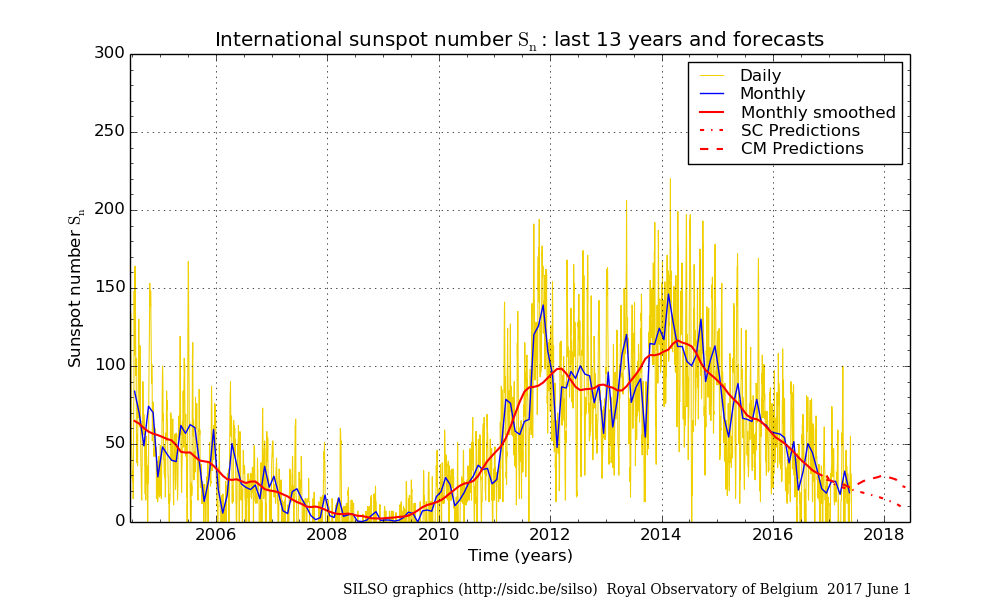
Figure 18. Daily, Monthly, and Monthly SIDC Sunspot Number for the past 13 years
To attain years with a similar climatic background state and account for low frequency AGW, the top 30 ranks wrt the annually-averaged HADCRUT 4.5.0.0 global temperature were given one point.
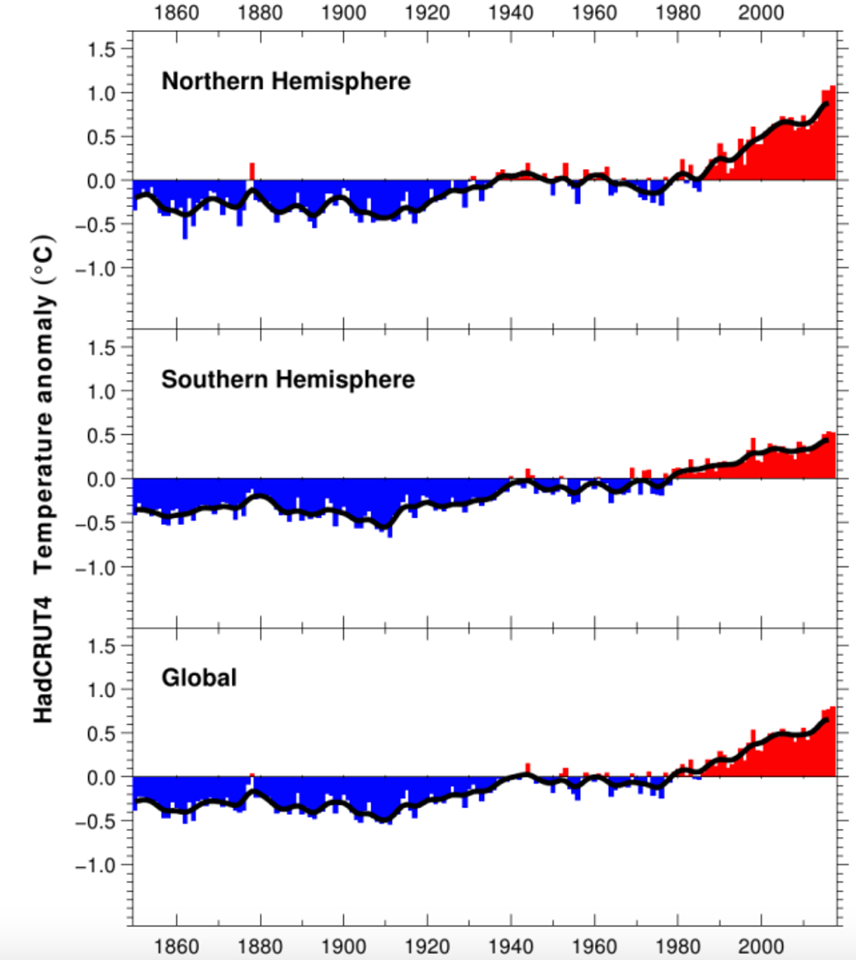
Figure 19. HADCRUT 4.5.0.0 annually averaged northern hemisphere (top), southern hemisphere (middle), and global (bottom) temperature anomalies vs the 1961-1990 base period.
To find years with relatively similar atmospheric variability, several northern hemisphere teleconnections were analyzed, including the Arctic Oscillation (AO), North Atlantic Oscillation (NAO), Pacific-North American (PNA) pattern, Eastern Pacific Oscillation (EPO), and Western Pacific Oscillation (WPO). These indices were created from NOAA’s 20th Century Reanalysis Version 2c (1851-2014) and NCEP-NCAR Reanalysis (2015-present) for the FMA period and years with the correct phase (positive, negative, or neutral (within +/- 0.5 sigma)) were identified and received 2 tenths of a point for each index.
For NOAA’s 20CRv2c EPO data see:
http://weatheradvance.com/home/weather/weatheradvance.com/wp-content/uploads/2016/04/EPO-Index-Time-series-1851-2014-NOAA-20CRv2c.txt
For NOAA’s 20CRv2c WPO data see:
http://weatheradvance.com/home/weather/weatheradvance.com/wp-content/uploads/2016/04/WPO-Index-Time-series-1851-2014-NOAA-20CRv2c.txt
The following table summarizes the collection of ocean-atmosphere teleconnections and variables used in the derivation of our hurricane season analogs.
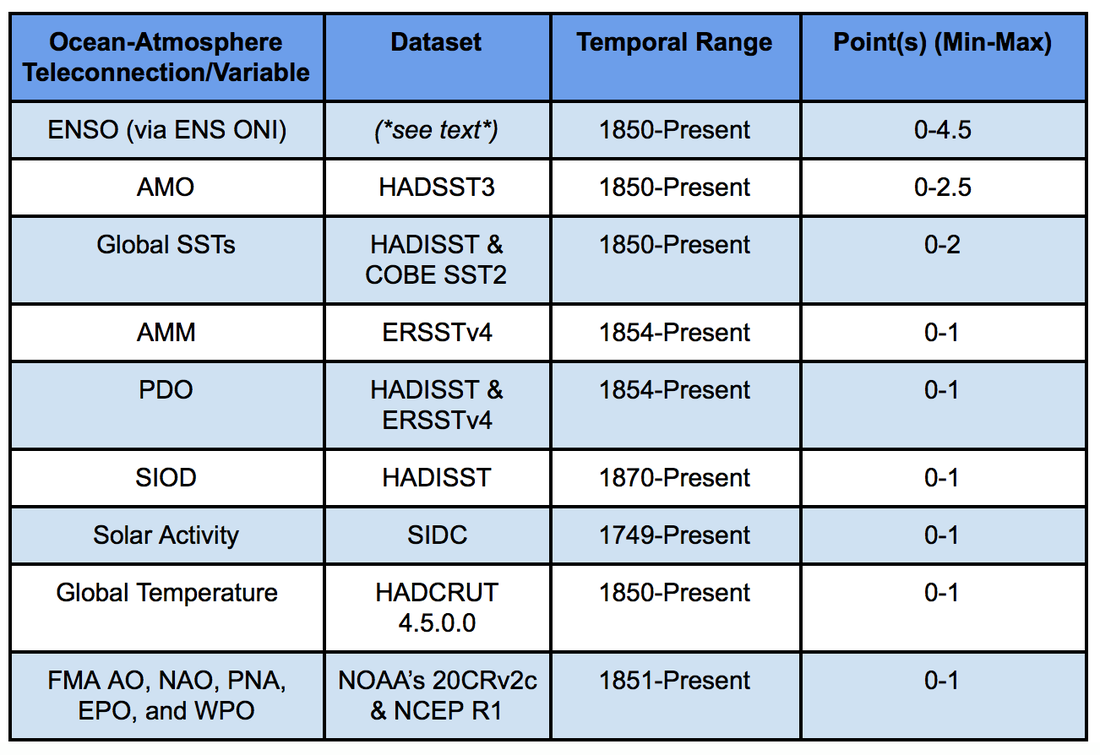
Figure 20. Table of Ocean-Atmospheric teleconnections, datasets, temporal ranges, and min-max possible points used to construct the hurricane season analogs.
*See text:* The ENS ONI (Ensemble Oceanic Nino Index) was constructed from 24 sea surface temperature reconstructions, satellite based datasets, and atmospheric reanalysis, see:
http://weatheradvance.com/home/weather/weatheradvance.com/wp-content/uploads/2017/06/ERSSTv4-AMM-Index-1865-Apr-2017.txt
*See text:* The ENS ONI (Ensemble Oceanic Nino Index) was constructed from 24 sea surface temperature reconstructions, satellite based datasets, and atmospheric reanalysis, see:
http://weatheradvance.com/home/weather/weatheradvance.com/wp-content/uploads/2017/06/ERSSTv4-AMM-Index-1865-Apr-2017.txt
Given the aforementioned information, the following years were defined as analogs (in sequential order) and corresponding point values are provided. Years which attained 7 or more points were denoted as an analog.
Rank Year Points
#01 1961 11.1
#02 1891 10.1
#03 1927 9.3
#04 1932 9.2
#05 1993 9.1
#06 2007 8.9
#07 1929 8.7
#08 1928 8.5
#09 2003 8.1
#10 1953 7.7
#10 2004 7.7
#10 2005 7.7
#10 2006 7.7
#14 1895 7.6
#15 1944 7.4
#16 1948 7.1
#16 2013 7.1
#18 2014 7.0
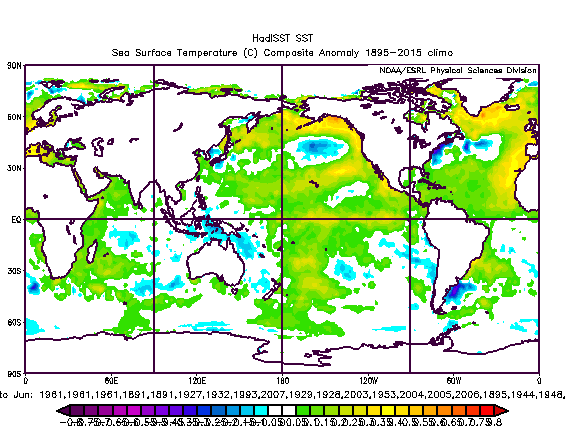
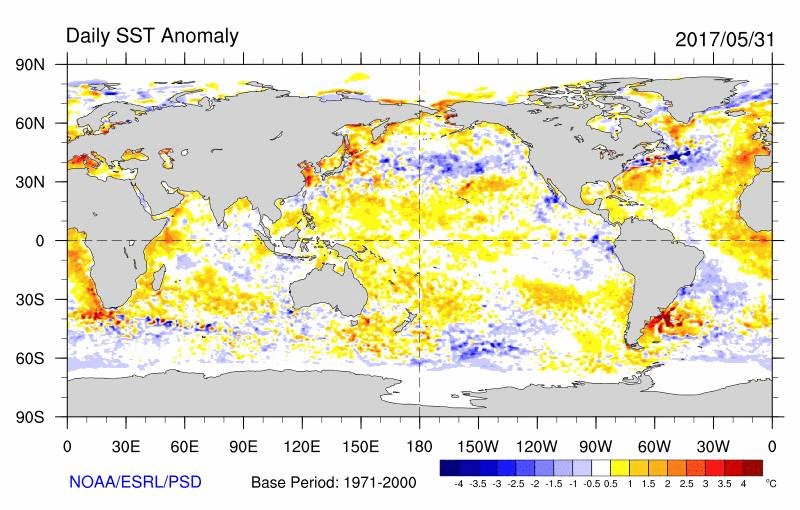
These figures depict the global SSTA initialization of the hurricane season analogs for May-June (top, figure 21) against the current global SSTAs (bottom, figure 22)
Discussion:
We currently anticipate the 2017 Atlantic hurricane season to be moderately above the 1951-2000 average, with approximately 13-17 named storms, 7-11 hurricanes, and 3-5 major hurricanes developing across the Atlantic basin. Warm ENSO neutral conditions are likely to prevail for at least the next several months, and this should allow for wind shear in the Main Development Region (MDR) to remain closer to normal. Despite the current positive subtropical Indian Ocean Dipole regime and long-term degradation of tropical easterly jet that favors less Sahel rainfall and weaker African Easterly Waves, the African Sahel is liable to be near-wetter than average as we are likely entering an active/wet multidecadal era. The current sea surface temperatures in the tropical North Atlantic are running above normal and the Atlantic Meridional Mode is currently running slightly positive, both of which tend to be more conducive to above normal precipitation over western Africa and poleward displacement of the Intertropical Convergence Zone (ITCZ) in the near equatorial Atlantic. The combination of these aforementioned factors is expected to yield a conducive environment for tropical cyclogenesis and intensification over the east-central tropical Atlantic, thus leading to higher than normal tropical cyclone activity across a majority of the MDR, with a large fraction of these TCs potentially tracking near or just north of the Greater Antilles and into the southwestern Atlantic/Sargasso Sea.
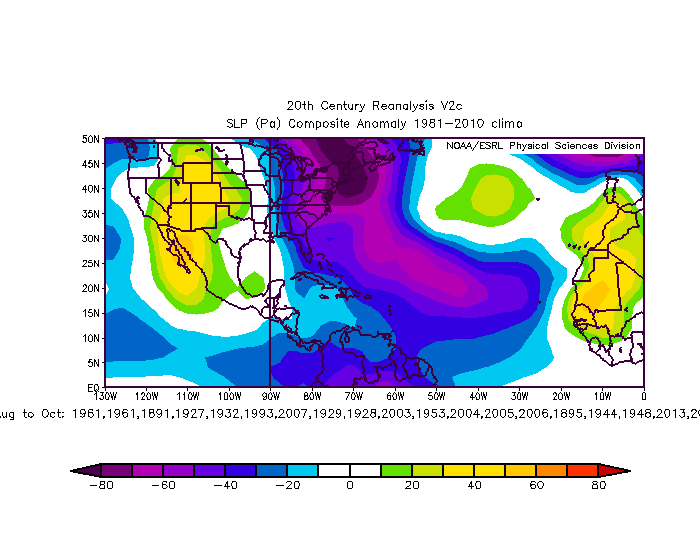
Figure 23. Hurricane Season Analogs Mean Sea Level Pressure Anomalies (SLPAs) August-September-October (ASO) via NOAA’s 20th Century Reanalysis Version 2c
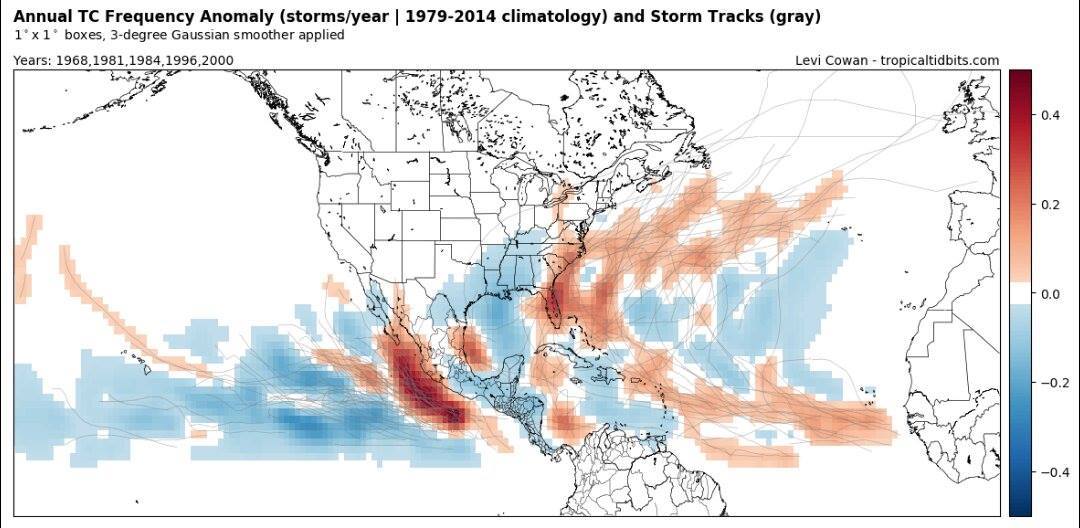
Figure 24. CDAS1 Monthly Top 5 SSTa Analog TC Frequency Anomalies (April 2017) via Levi Cowan tropicaltidbits.com
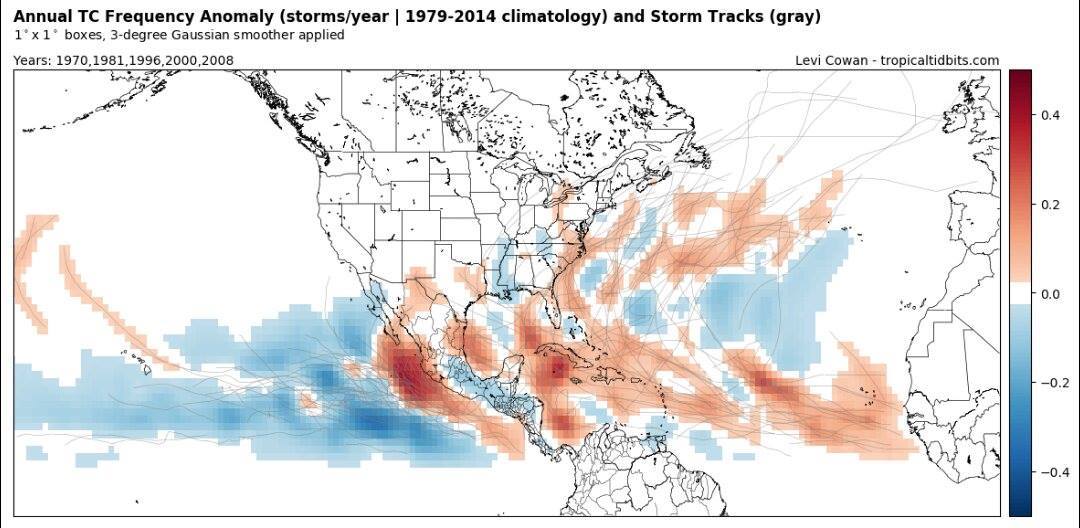
Figure 25. CDAS1 Monthly Top 5 SSTa Analog TC Frequency Anomalies (May 2017) via Levi Cowan tropicaltidbits.com
While TC activity is liable to remain above average in the subtropical Atlantic and outside the MDR thanks to an abnormally enlarged Atlantic Hadley Cell, increasingly favorable conditions in the MDR suggest the relative ratio of TCs and accumulated cyclone energy (ACE) between the deep tropics and subtropical Atlantic may be closer to the long-term average this season than what’s been observed over the past several years. The expectation of above normal TC activity in the northeastern Pacific basin, aided in part by the warm PDO and ongoing warm neutral ENSO event may attempt to thwart TC development and intensification in the Caribbean Sea and Gulf of Mexico via increased upper level westerly wind shear imparted by NE Pacific TC divergent upper level outflow and large-scale upper level convergence/descent. However, many of the seasonal analogs suggest the potential for above-well above activity here, and if conditions become increasingly unfavorable in the Northeastern Pacific and/or tropical cyclones in the east-central MDR struggle to intensify, higher ACE and TC track densities may be realized, therefore confidence in overall activity in this portion of the Atlantic basin is low-very low. The persistence of the warm PDO regime may serve to dampen any oncoming -ENSO event and induce a longwave pattern that favors large-scale troughiness in the vicinity of southeastern Canada this summer, a pattern that often supports recurvature of Atlantic TCs before they hit the US. However, the persistence of above average sea surface temperature anomalies on the western flank of the Azores-Bermuda high, near the eastern seaboard of the US, as well as the potential for the current +PDO to weaken, at least slightly, implies that this longwave pattern may not be so clear cut. In fact, if the +SSTAs were to continue in the vicinity of the Sargasso Sea, this could lead to the development of anomalous upper level blocking ridge over New England and Atlantic Canada, as mean southwesterly flow around the Azores-Bermuda high would advect warmer than normal air into this region, attributable to the aforementioned warmer than normal SSTs in the Sargasso Sea. The persistence of an upper level blocking ridge over Atlantic Canada and New England would suggest a heightened risk of TC landfalls on the US eastern seaboard this season given the expectation of above normal tropical cyclone activity in the southwestern Atlantic. However, appreciable uncertainty exists in the amplitude, evolution, and placement of this upper level ridge, as well as the individual tropical cyclones and synoptic steering flow patterns associated with them. Therefore, it’s unknown precisely who will be affected (if at all) by any oncoming tropical cyclones from the MDR, Caribbean Sea, Gulf of Mexico, and/or southwestern Atlantic.
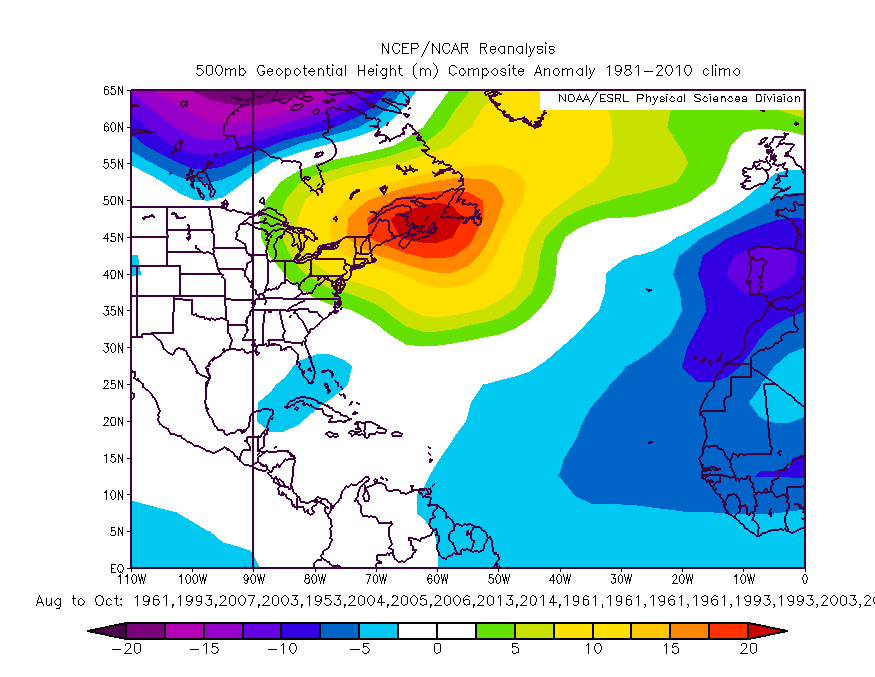 |  |
Figures 26 (left) and 27 (right) denote the August-September-October (ASO) 500mb height anomalies for our hurricane season analogs and the CANSIPS model respectively.
Additionally, it’s worth mentioning here that individuals should not be focused simply on the median Named Storm, Hurricane, Major Hurricane, counts and ACE values presented. Rather, one should be fully aware of the unpredictability, uncertainties, and spectrum of reasonable, potential variability for this upcoming season. While we are currently forecasting a moderately above average hurricane season, it’s fairly plausible that this upcoming hurricane season ends up closer to the long-term average with little-if any tropical cyclone impacts on the US mainland, or becomes borderline hyperactive with several tropical cyclone landfalls on the US coast. In any case, all individuals and interests in and around the Caribbean Sea, Gulf of Mexico, and the rest of the Atlantic basin should be equally prepared for this hurricane season and should review their hurricane and evacuation plans thoroughly in the event of an oncoming tropical cyclone.
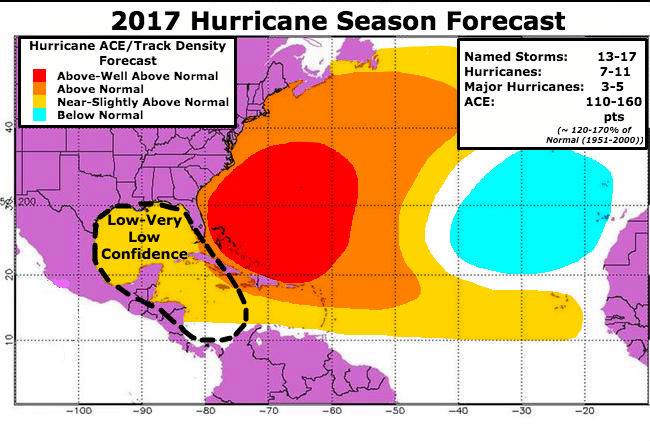
Figure 28. The 2017 Hurricane Season Forecast highlighting the number of Named Storms, Hurricanes, Major Hurricanes, and ACE expected for the 2017 hurricane season.
References
Aiyyer, Anantha R., and Chris Thorncroft. "Climatology of Vertical Wind Shear over the Tropical Atlantic." Journal of Climate 19.12 (2006): 2969-983. Web.
Amaya, Dillon J., Michael J. Deflorio, Arthur J. Miller, and Shang-Ping Xie. "WES Feedback and the Atlantic Meridional Mode: Observations and CMIP5 Comparisons." Climate Dynamics (2016): n. pag. Web.
Chiang, John C. H., and Daniel J. Vimont. "Analogous Pacific and Atlantic Meridional Modes of Tropical Atmosphere–Ocean Variability*." Journal of Climate 17.21 (2004): 4143-158. Web.
Climate Explorer: Starting Point. N.p., n.d. Web. 01 June 2017.
Compo, G. P., J. S. Whitaker, P. D. Sardeshmukh, N. Matsui, R. J. Allan, X. Yin, B. E. Gleason, R. S. Vose, G. Rutledge, P. Bessemoulin, S. Brönnimann, M. Brunet, R. I. Crouthamel, A. N. Grant, P. Y. Groisman, P. D. Jones, M. C. Kruk, A. C. Kruger, G. J. Marshall, M. Maugeri, H. Y. Mok, Ø Nordli, T. F. Ross, R. M. Trigo, X. L. Wang, S. D. Woodruff, and S. J. Worley. "The Twentieth Century Reanalysis Project." Quarterly Journal of the Royal Meteorological Society 137.654 (2011): 1-28. Print.
Hirahara, Shoji, Masayoshi Ishii, and Yoshikazu Fukuda. "Centennial-Scale Sea Surface Temperature Analysis and Its Uncertainty." Journal of Climate 27.1 (2014): 57-75. Web.
Hopsch, Susanna B., Chris D. Thorncroft, and Kevin R. Tyle. "Analysis of African Easterly Wave Structures and Their Role in Influencing Tropical Cyclogenesis." Monthly Weather Review 138.4 (2010): 1399-419. Web.
Huang, Boyin, Viva F. Banzon, Eric Freeman, Jay Lawrimore, Wei Liu, Thomas C. Peterson, Thomas M. Smith, Peter W. Thorne, Scott D. Woodruff, and Huai-Min Zhang. "Extended Reconstructed Sea Surface Temperature Version 4 (ERSST.v4). Part I: Upgrades and Intercomparisons." Journal of Climate 28.3 (2015): 911-30. Web.
Kalnay, E., M. Kanamitsu, R. Kistler, W. Collins, D. Deaven, L. Gandin, M. Iredell, S. Saha, G. White, J. Woollen, Y. Zhu, A. Leetmaa, R. Reynolds, M. Chelliah, W. Ebisuzaki, W. Higgins, J. Janowiak, K. C. Mo, C. Ropelewski, J. Wang, Roy Jenne, and Dennis Joseph. "The NCEP/NCAR 40-Year Reanalysis Project." Bulletin of the American Meteorological Society 77.3 (1996): 437-71. Web.
Kennedy, J. J., N. A. Rayner, R. O. Smith, D. E. Parker, and M. Saunby. "Reassessing Biases and Other Uncertainties in Sea Surface Temperature Observations Measured in Situ since 1850: 1. Measurement and Sampling Uncertainties." Journal of Geophysical Research 116.D14 (2011): n. pag. Web.
Kennedy, J. J., N. A. Rayner, R. O. Smith, D. E. Parker, and M. Saunby. "Reassessing Biases and Other Uncertainties in Sea Surface Temperature Observations Measured in Situ since 1850: 2. Biases and Homogenization." Journal of Geophysical Research 116.D14 (2011): n. pag. Web.
Klotzbach, Philip J., and Michael M. Bell. "EXTENDED RANGE FORECAST OF ATLANTIC SEASONAL HURRICANE ACTIVITY AND LANDFALL STRIKE PROBABILITY FOR 2017." (2017): n. pag. Web.
Laing, Arlene, Dr. "Tropical Variability." Introduction to Tropical Meteorology. N.p.: n.p., n.d. N. pag. Print.
Mantua, Nathan J., and Steven R. Hare. "The Pacific Decadal Oscillation." Journal of Oceanography 58 (2002): 35-44. Web.
Nicholson, S. E., A. I. Barcilon, M. Challa, and J. Baum. "Wave Activity on the Tropical Easterly Jet." Journal of the Atmospheric Sciences 64.7 (2007): 2756-763. Web.
Rayner, N. A. "Global Analyses of Sea Surface Temperature, Sea Ice, and Night Marine Air Temperature since the Late Nineteenth Century." Journal of Geophysical Research108.D14 (2003): n. pag. Web.
Saji, N. H., B. N. Goswami, P. N. Vinayachandran, and T. Yamagata. "A Dipole Mode in the Tropical Indian Ocean." Nature 401.6751 (1999): 360-63. Web.
Team, ESRL Web. "NOAA Earth System Research Laboratory." ESRL News. N.p., n.d. Web. 01 June 2017.
Trenberth, Kevin E., and Timothy J. Hoar. "El Niño and Climate Change." AGU Publications24.23 (1997): 3057-060. Web.
Zhang, Rong, and Thomas L. Delworth. "Impact of Atlantic Multidecadal Oscillations on India/Sahel Rainfall and Atlantic Hurricanes." Geophysical Research Letters 33.17 (2006): n. pag. Web.